
 ChatGPT
 Perplexity
 Claude
 Gemini
 Grok

Key takeaways
- Break-even ROAS is 1 divided by your profit margin, so a 40% margin needs a real 2.5 ROAS to win.
- Count only costs that rise with each sale. Gross margin makes a risky floor look safe, and that is a costly, painful lie.
- A 30% discount can nearly triple the ROAS you need, because your costs refuse to shrink.
- Platform medians are weak context. Your own margin sets the honest target.
Picture a Tuesday morning. The dashboard says 2.8 ROAS, and the team feels proud and relieved. Then finance opens the bank account, and the numbers refuse to match.
Nobody lied. Nobody checked the floor. A ROAS calculator exists for that painful gap, because revenue is not profit, and hope is not a plan. That sinking feeling is common, and it is avoidable.
What is a ROAS calculator?
A ROAS calculator divides the revenue your ads bring in by what you spent on them. It answers one simple, honest question: how many dollars come back for each dollar of spend? HubSpot defines the metric as revenue attributed to ads divided by ad spend. A good ROAS calculator also shows the hard truth: your break-even line.
What is ROAS? ROAS (return on ad spend) is revenue from ads divided by ad spend. A ROAS of 3 means $3 of revenue for every $1 of ads, which sounds great until your thin margin says otherwise.
Plain ROAS ignores margin, and that is a dangerous trap. A 3.0 feels great on a 60% margin product. On a 20% margin product, it hurts. The break-even line is what makes the number truly useful.
How do you use this ROAS calculator?
Enter your price, product cost, shipping, payment fees, and expected returns. This ROAS calculator turns them into a margin, then into your break-even ROAS. Add your ad spend and ad revenue to see your real ROAS beside the floor. It is fast, simple, and honest.
Here is what each input really does:
- Price: what the customer truly pays after any discount.
- Product cost: what you honestly pay to make or buy the item, with no wishful rounding.
- Shipping and packing: the real cost of getting each order out the door.
- Payment fees: the processor’s cut of every sale, which adds up fast.
- Return allowance: the share of orders that come back, priced as a cost per order, because returns hurt and they sting.
The answer shows on screen first, and nothing hides behind a form or feels like a trap. Press Email me the report when you want a clean copy with your inputs and a short, plain read. Prefer a steady watch? See how ROAS monitoring on a schedule works.
How do you calculate break-even ROAS by hand?
Break-even ROAS equals 1 divided by your profit margin. Trendtrack gives a simple example: a 25% margin means a break-even ROAS of 4. Do one order by hand first, so the math feels real and the worry fades. Then the ROAS calculator repeats it across your whole catalog, fast.
Take a $50 item. The product costs $17, shipping runs $7, and fees take $2. Returns cost $4 per order on average. That is $30 in costs and $20 of profit, so the margin is a healthy 40%, and the math is simple, clear, and fair.
Divide 1 by 0.40 and you get 2.5. Every ad dollar must bring back $2.50 before you earn a single cent, so the risk is real.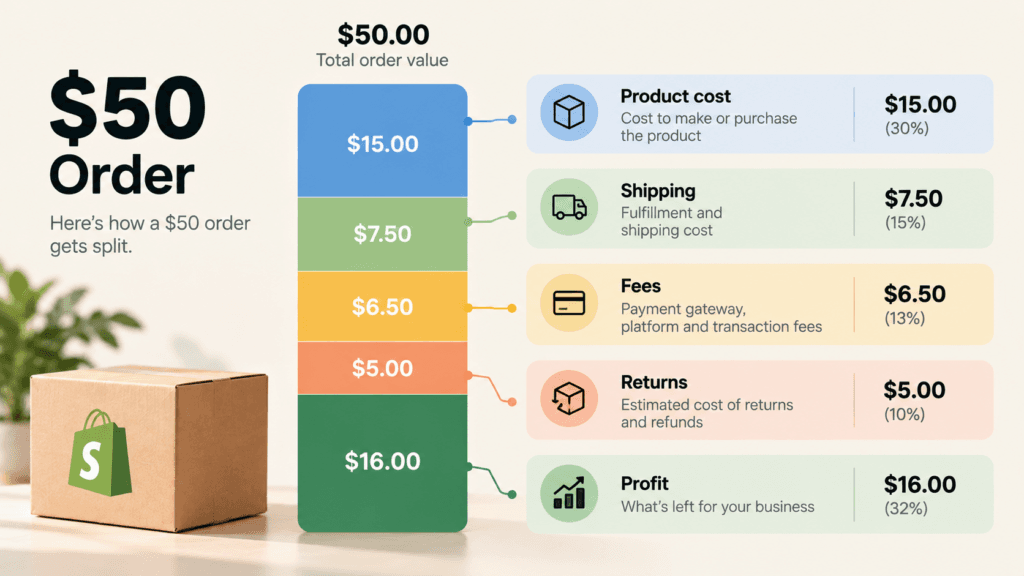
Which costs belong in a ROAS calculator?
Only costs that rise with each sale belong in the margin: product cost, shipping, packaging, payment fees, and returns. Fixed costs such as salaries and rent stay out, and that keeps the math fair, as Trendtrack notes. Use gross margin by mistake and your floor looks far too friendly, which is a dangerous mistake.
The margin sets the bar, and a thin margin raises it fast. These pairs come from the same formula, as Super-scale’s break-even table shows:
| Profit margin | Break-even ROAS |
|---|---|
| 60% | 1.7 |
| 50% | 2.0 |
| 30% | 3.3 |
| 20% | 5.0 |
| 10% | 10.0 |
Returns are the cost most teams forget, and forgetting hurts. A product that comes back one time in ten quietly eats the margin you thought you had. Add it to the ROAS calculator before you trust any answer, because a rosy number is worse than none and far more dangerous.
How does a discount change your ROAS calculator result?
A discount cuts your price but never your costs, so margin collapses and break-even ROAS jumps. Take the $50 item at 30% off. The price falls to $35, costs stay near $30, and profit shrinks to about $5. Margin is now a thin 14%, and the floor climbs to roughly 7.
Same ad. Same product. Nearly triple the bar. That is why sale-season losses show up weeks late, when the bank balance finally tells the brutal truth.
Ad costs rise too, and the pressure is relentless. Meta’s own filing shows the average price per ad up 12% from a year earlier, in the second quarter of 2026, so the squeeze is real. Run the ROAS calculator at your sale price before you build the offer, not after the bad news lands. The Black Friday marketing strategy guide walks through the full countdown, and the Shopify Black Friday prep guide covers feeds and creative.
What is a good ROAS compared with break-even?
A good ROAS is any number comfortably above your own break-even ROAS. Platform medians are weak context, and they can mislead. Super-scale reports that Triple Whale’s 2025 data puts median Meta ROAS at 1.86 across nearly 35,000 ecommerce brands, and Google at 3.68.
A 2.5 ROAS wins on a 60% margin and loses on a 20% margin. That is the honest answer to the question people type most. The benchmark is vendor data, so treat it as a rough guide, never a promise and never proof.
Set your target above the floor, and pick a safe buffer you can defend when the boss asks hard questions. Your ROAS calculator result is the anchor. The guide on what a good ROAS looks like goes deeper on targets by margin.
When does a ROAS calculator mislead you?
A ROAS calculator misleads when the revenue number is wrong or the margin hides a cost. Platform-reported revenue can overlap across channels, and lifetime value sits outside the math. Marketing efficiency ratio divides total revenue by total marketing spend, which HubSpot describes as a blended view.
Watch for three sneaky traps, because each one hides a real loss behind a pretty number:
- Double counting: two platforms both claim the same sale, and both feel proud.
- New versus returning buyers: a loyal repeat customer flatters ROAS.
- Missing costs: agency fees and creative production sit outside ad spend, so the real bill is bigger.
Trust both numbers, because each one catches the blind spots the other misses. For the blended view, open the marketing efficiency ratio explained, and see how omnichannel measurement works when the platforms disagree. Then compare it with your CAC calculator result for the same weeks, and a weak month shows up fast.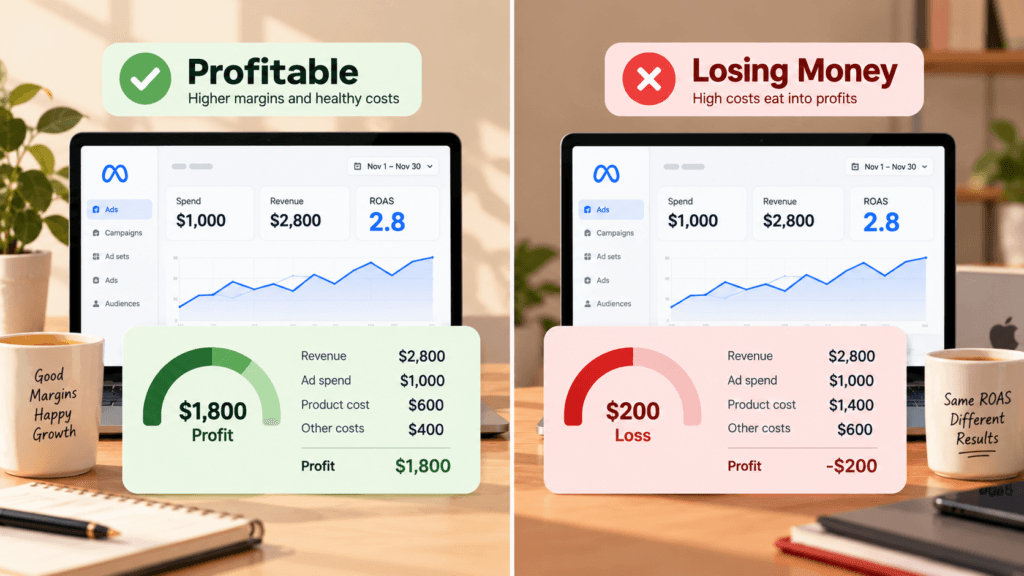
What should you do with your ROAS calculator result?
Turn the number into three decisions: a floor that pauses weak ads, a target that scales strong ads, and a review rhythm. Write them down before the next campaign starts, while the stakes feel calm. A floor you check only once a month cannot save the budget you lose this week.
The check is the dull part, and dull is where money leaks. ShopOS runs a ROAS Performance Digest routine through Gavin, its performance agent, so the floor gets watched on a schedule instead of on a lucky day. The agent warns you early. You decide, and you stay in control.
Imagine you check the floor every Monday. You spot a weak ad on day three, not day thirty. The loss is small, the lesson is cheap, and the calm feels wonderful. Now picture the opposite: a month of silent leaks, and a gut punch at the end.
Need a second opinion on your numbers? Book a call and bring your break-even ROAS and your last 30 days of ad data. Bad news found early is cheap.
FAQ
What is a ROAS calculator?
A ROAS calculator divides ad revenue by ad spend to show how many dollars each ad dollar returns. A smart one also takes your margin and shows break-even ROAS, so you can tell whether a result earns real money or only looks good on a happy dashboard.
How do I calculate break-even ROAS?
Divide 1 by your profit margin as a decimal. A 40% margin gives 1 divided by 0.40, or 2.5. Count only costs that rise with each sale, such as product, shipping, fees, and returns, and leave out fixed costs like salaries and rent. Honest inputs give an honest answer.
Is a 2.5 ROAS good?
It depends on your margin. A 2.5 ROAS breaks even at a 40% margin, so it earns nothing there and feels risky. It earns strong profit at a 60% margin and loses money at a 20% margin. Compare it with your own break-even ROAS, never a platform average.
What does 4:1 ROAS mean?
A 4:1 ROAS means $4 of revenue for every $1 of ad spend. It breaks even at a 25% margin, which is thin. Super-scale notes the 4:1 rule of thumb traces to a 2016 Nielsen study of consumer goods brands, so it may be wrong for your margin.
Should returns go into a ROAS calculator?
Yes. Returns cut the profit on each order and hurt more than most teams admit, so they belong in your margin. Estimate the average return cost per order and add it to your product, shipping, and fee costs. Skipping returns makes your break-even ROAS look lower than it really is, which is a costly mistake.
What is the difference between ROAS and MER?
ROAS divides revenue attributed to ads by ad spend. MER, or marketing efficiency ratio, divides total revenue by total marketing spend. ROAS shows which campaigns win or fail. MER gives a blunt, honest check that does not trust any one platform’s attribution.
How often should I recalculate break-even ROAS?
Recalculate whenever price, product cost, shipping rates, or discount depth changes, because stale numbers lie. Run it before every sale, because a discount can nearly triple the ROAS you need and punish a careless launch. For stable products, a quarterly check is enough, and an early check beats a late surprise.


